Projects Data Analytics

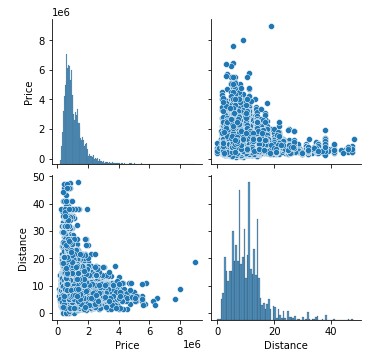
Melbourne House Price Segmentation
The purpose of this project is to analyze the factors that affect property prices in Melbourne and can be used as consideration in making decisions or strategies. More details

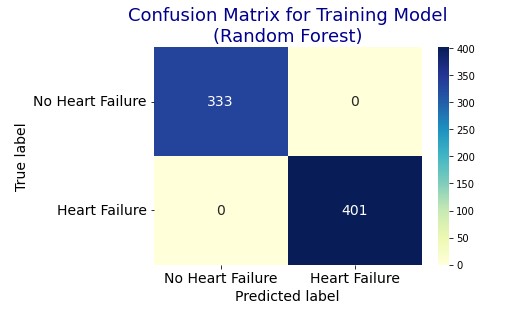
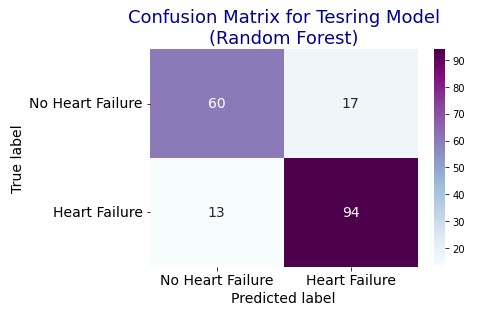
Heart Failure Prediction
A simple process of regression heart failure case using Random Forest and Logistic Regression. The purpose of this project is to help prediction heart failure using clinical features. More details

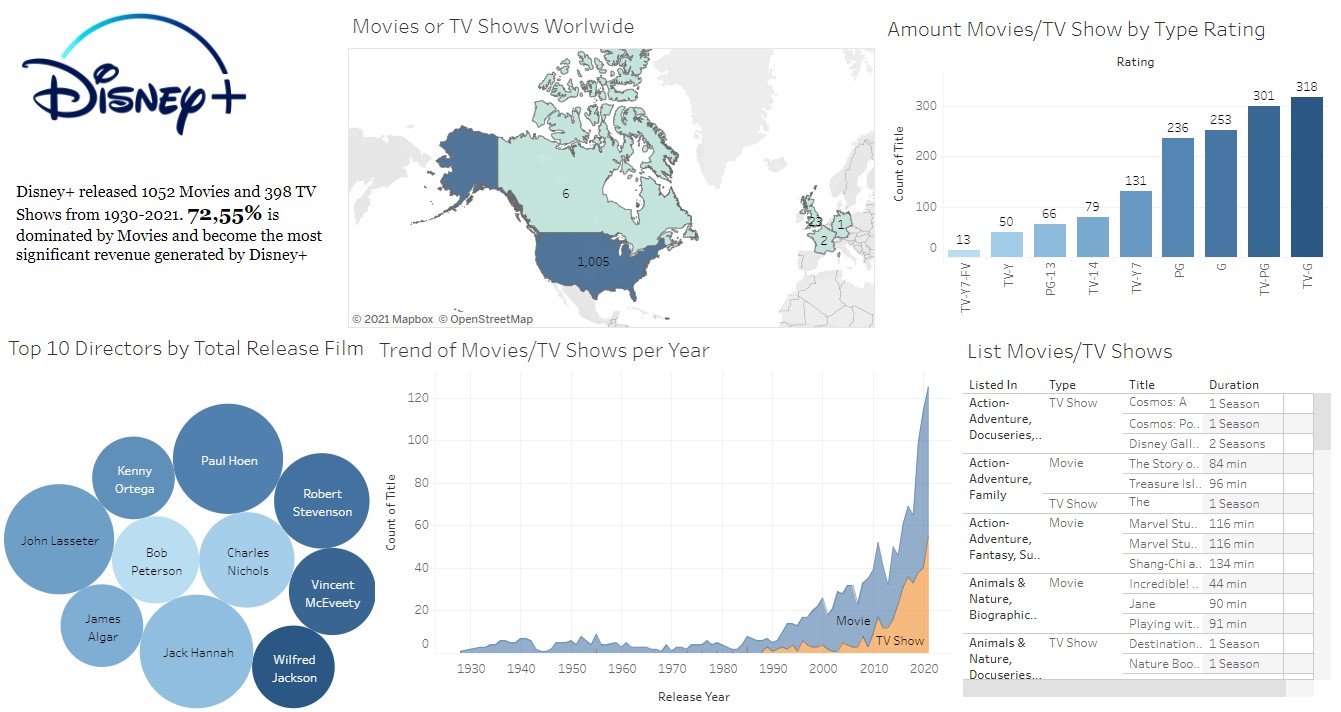
Disney+ Dashboard
Dashboard visualization to describe the trend of movies and tv shows released by Disney+ from 1930-2021 equipped with a comparison of each type rating, top directors and the number of titles around the world. More details